The fall of GE is nothing short of stunning. As the Wall Street Journal reports, “[T]he stock value lost by GE in the past 12 months is twice the amount that vanished when Enron Corp. collapsed in 2001—and more than the combined market capitalization erased by the bankruptcies of Lehman Brothers and General Motors during the financial crisis. Longer term, GE’s market capitalization has fallen more than $460 billion since its 2000 peak.”
A careful analysis of GE’s Corporate Watchdog Report shows that in recent years GE has generated an enormous amount of income from an unusual source: changes in accounting estimates. Over $7 billion, in fact, since 2013.
While these changes may seem insignificant at first for a company with annual revenue of $122 billion, they appear much more substantial when compared to pre-tax income and net income, which has been under $10 billion since 2015.
What is a Change in Accounting Estimates?
A change in accounting estimates is a change in a parameter–often a percentage–that is often thought of and usually treated as a constant in accounting.
To illustrate, let’s consider a company’s net receivables. The value of a company’s net receivables is the percent of accounts receivable that will actually be paid. Let p be the percent of accounts receivable that will be collected. We can think of the net receivables as a simple formula
NR = p · AR
Net Receivables = p · (Accounts Receivable)
The value of net receivables depends on both the accounts receivable and the percent that will be collected. Net receivables and the accounts receivable are variables in this equation, and the percent that will be collected is a parameter or a constant. The parameter p is an accounting estimate, and a change in p is a change in an accounting estimate.
In this simple equation, a change in accounting estimates refers to a change in the parameter, p. Any change p will directly affect net receivables, even if accounts receivable did not change.
While a change in the accounts receivable variable (AR) will also change net receivables, this is not considered a change in accounting estimates. Net receivables ordinarily varies with accounts receivable from one period to the next. A change in accounting estimates refers to a change in the parameters, not a change in the variables.
How do accountants estimate parameters like p? Usually, accounting estimates are based on historical patterns or prevailing economic conditions. A change in accounting estimates signifies a material change in either the company’s performance or in the economic environment. In this example, a change in the accounting estimate of p would indicate a material change in the company’s ability to collect payments on its accounts receivable.
GE’s Recent Changes in Accounting Estimates
With this in mind, let’s take a look at GE’s changes in accounting estimates for the past five years.
Table 1. GE’s Changes in Accounting Estimates, 2013-18
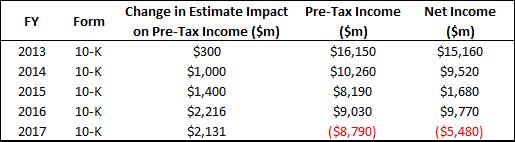
Sources: Pre-Tax Income and Net Income data from MarketWatch.
In each of the last five years, GE has report a change in accounting estimates affecting revenue recognition related to contract accounting including percentage-of-completion. The impact of these changes has increased steadily over the last five years, growing from $300 million in 2013 to over $2 billion in both 2016 and 2017. Relative to pre-tax income, these changes in accounting estimate were 17% and 25% of pre-tax income in 2015 and 2016, and 24% of pre-tax income (in absolute value) in 2017.
The impact on GE’s net income from these changes is even larger–the change in 2015 constituted 83% of GE’s net profit for the year.
Peer and Industry Comparisons
How common are changes in accounting estimates in GE’s peer group and industry?
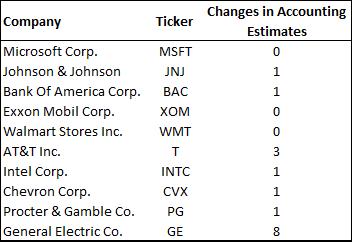
This table is a comparison of the number of changes in accounting estimates for GE and the companies GE has named as a peer.
Table 2. Peer Group Changes in Accounting Estimates, 2013-18
GE’s NAICS code is 333414. GE is classified as a member of the Machinery Manufacturing industry.
This table shows a histogram of companies with one or more changes in accounting estimates from GE’s industry. All companies on the graph are from the following industries:
-
NAICS 333 - Machinery Manufacturing
-
NAICS 335 - Electrical Equipment, Appliance, and Component Manufacturing
Additionally, this histogram is only for companies that reported one or more changes in accounting estimates in the period. In total, 66 companies reported 124 changes in accounting estimates over this period.
Graph 1. Histogram of Changes in Accounting Estimates, 2013-18
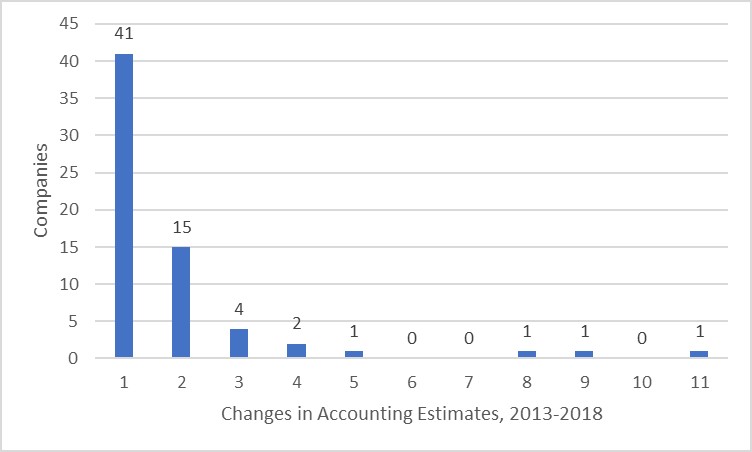
GE reported 8 changes in accounting estimates from 2013 to 2018. Only two companies in these industries reported more changes than GE in this period– Babcock & Wilcox Enterprises, Inc. with a market cap of $250m, and Enphase Energy, Inc. with a market cap of $222m.
While there are no other companies as large as GE, there are a few companies comparable in scale in these industries.
Table 3. Changes in Accounting Estimates for Largest Industrial Comparables, 2013-18
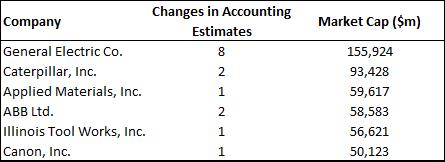
Based on this, it seems evident that the frequency of GE’s changes in accounting estimates is unusual for both its peer group and its industry. No other company of a comparable scale in its industry has reported the number of changes in accounting estimates as GE has.
What about other comparables? Some industries frequently report changes in accounting estimates, such as the Aircraft Manufacturing industry. Let’s look at Boeing and Northrup Grumman as examples of large manufacturers in that industry.
Boeing has a market cap of $204 billion and annual revenue of $93.4 billion. Boeing reported 21 changes in accounting estimates from 2013 to 2018. Of these, 13 had a positive effect and 8 had a negative effect. Those with a negative effect tended to be less frequent but larger in magnitude than the positive ones.
Northrop Grumman has a market cap of $58.9 billion and annual revenue of $25.8 billion. From 2013 to 2018, Northrop Grumman reported 22 changes in accounting estimates. Unlike Boeing, these were almost uniformly positive in their effects, although of a similar magnitude to those reported by Boeing. Notably, the impact of Northrup Grumman’s changes in accounting estimates has steadily decreased since 2013, whereas GE’s has increased dramatically.
This table shows the annual impact of changes in accounting estimates on pre-tax income for GE, Boeing, and Northrup Grumman.
Table 4. Impact on Pre-Tax Income
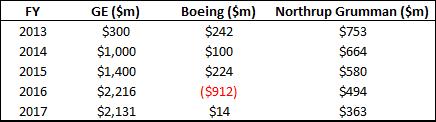
This table shows that the impact of GE’s changes in accounting estimates differ from those of Boeing and Northrup Grumman in that GE’s changes had a much larger impact on average and that the impact of GE’s changes steadily increased while the others steadily decreased (Northrup Grumman) or showed no clear trend (Boeing).
Because of their potential impact on the bottom line, changes in accounting estimates are always marked with a yellow flag in Corporate Watchdog Reports. However, GE gives us cause to ask how many yellow flags should we allow to pile up before we mark it red?
Joseph Burke, Ph.D. is the Senior Economist and Data Scientist at Corporate Watchdog Reports.